Curriculum Vitae (CV)
mauro.martino (at) mamartino.com
Founder of the Visual AI Lab
IBM Research
Mauro Martino PhD is a scientist and artist who focuses on information technology related to exploration, dissemination and sharing of knowledge. He uses artificial intelligence to explore and enhance understanding of the world, transforming any type of information, whether it is visual, acoustic, or semantic, into interactive tools that are beautiful and simple to use.
He explores and develops new ways to experience data:
- Creating new techniques to display and visualize data;
- Experimenting with new interaction methods and user involvement;
- Introducing artificial intelligence to help users analyze information;
- Creating transparent and more intuitive machine learning models;
- Finally, always trying to introduce beauty and elegance in every interactive narrative.
Originally from Italy, Mauro Martino is the creator and director of the “Visual Artificial Intelligence Lab” at IBM Research, with offices in Cambridge, MA and New York City. He is a Professor of Practice at Northeastern University.
His work appeared in numerous newspapers and magazines, including The Guardian, The Wall Street Journal, The New York Times, The Washington Post, Süddeutsche Zeitung, Der Spiegel, Le Figaro, Corriere della Sera, National Geographic, Scientific American, Popular Science, Wired, MIT News, Harvard News, etc.
Mauro was formerly an Assistant Research Professor at Northeastern University working with Albert-Laszlo Barabasi at Center for Complex Network Research and with David Lazer and Fellows at The Institute for Quantitative Social Science (IQSS) at Harvard University.
Previously, he was a research affiliate with the SENSEable City Lab at Massachusetts Institute of Technology (MIT) in Cambridge, working on data visualization within the lab’s many projects and his related research project, Urban Interaction Design while earning a PhD in Design and Technologies at Politecnico di Milano, Italy. His focus was to innovate the ways we visualize and explore of massive amount of human mobility and telecommunications data, in partnerships with Airsage - AT&T - BT - Orange – Sprint – TDC - Telecom Italia and in different nations Belgium, Denmark, England, France, Italy, USA.
During the past year his work has been featured in important textbooks such as “Network Medicine” from Harvard University Press, and “Network Science” from Cambridge University Press, and the textbooks about data visualization: “Data Visualization” (SAGE Publications) and “The Truthful Art” (New Riders Press).
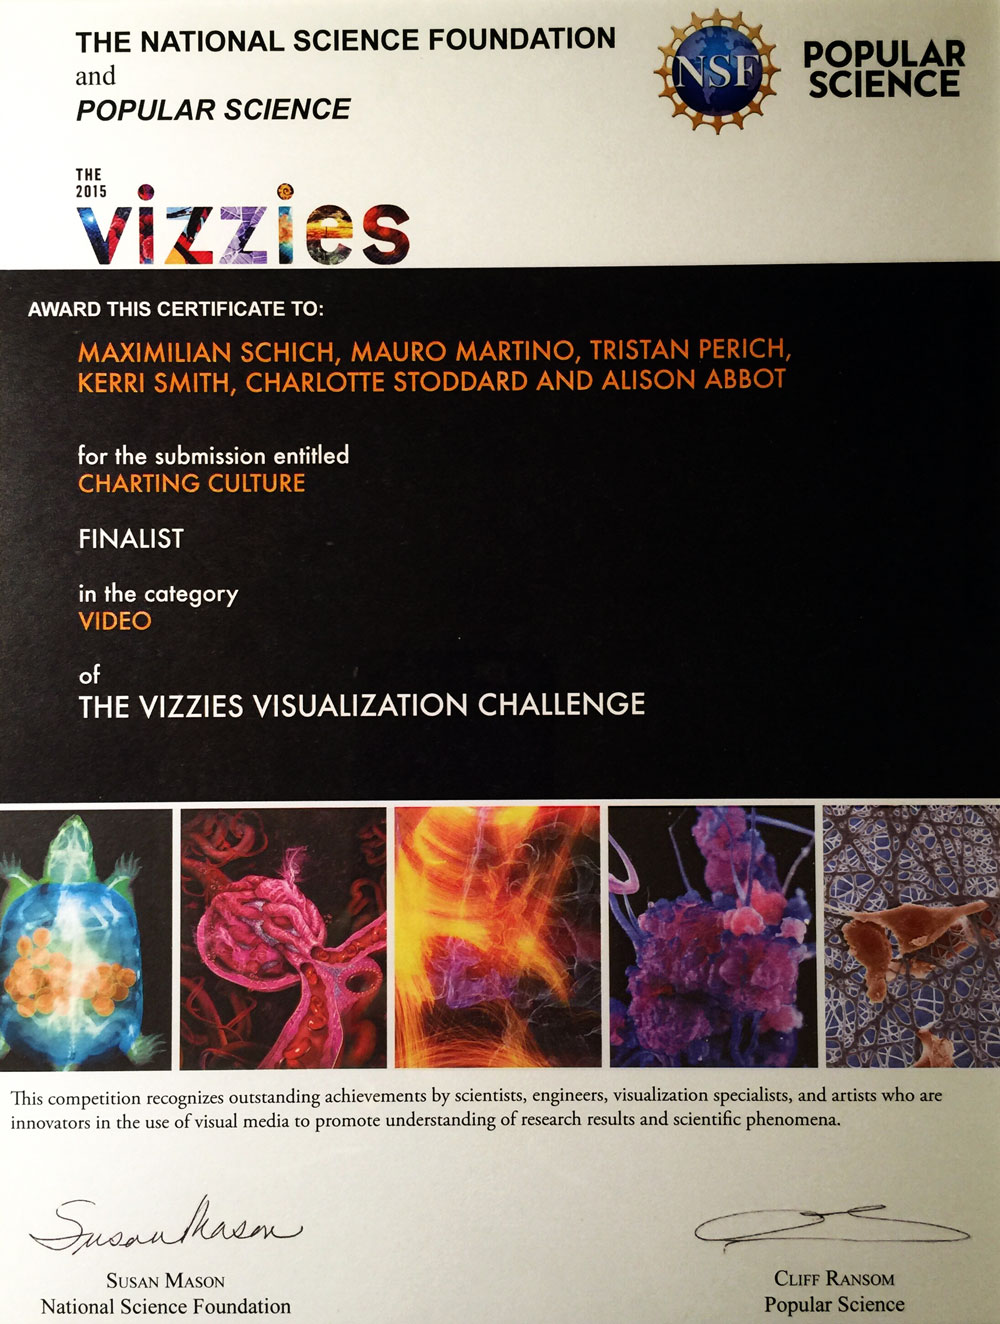
Mauro is an award-winning designer whose projects received the Gold Medal atThe 2017 Vizzies Visualization Challenge by National Science Foundation and Popular Science, Innovation by Design Award 2016 by Fast Company, Kantar Information is Beautiful Award 2016, Gold Medal in Data visualization at the Kantar Information is beautiful awards 2015, and finalist at The 2015 Vizzies Visualization Challenge, to name the most recent awards.
His works have also been featured in the books “The Best American Infographics" 2015 and 2016 editions.
The tools and videos he has developed are viewed by millions of users every year.
His projects have been shown at international festivals including Ars Electronica, TEDx Cambridge THRIVE, RIXC Art Science Festival, TEDx Riga. Martino’s award-winning software-based work has been exhibited in America, Europe, and Asia, including in The Serpentine Gallery (London), GAFTA (San Francisco), Lincoln Center (New York), “kim?” Contemporary Art Centre (Riga).
Martino’s works have been published in the scientific journals such Nature, Science, PNAS, Nature Communication, Nature Physics, among all.
Selected Awards, Exhibitions & Talks
NeurIPS 2018, Machine Learning for Creativity and Design
Vox2Net: From 3D Shapes to Network Sculptures, Montreal Convention Centre, Montreal, Canada, December 3-8, 2018
AI Art Gallery
NeurIPS AI Art GAllery 2018, Montreal Convention Centre, Montreal, Canada, December 3-8, 2018
IEEE InfoVis 2018 Art Exhibition
Data and Identities: VISAP’18 Exhibition, Berlin - Germany, October 23-26, 2018
Keynote
ICT Forum 2018 - Persone. Tecnologie. Competenze., Kilometro Rosso Innovation District, Bergamo - Italy, October 18, 2018
Keynote
Rixc Art Science Festival - Global Control, The National Library of Latvia, Riga - Latvia, 13 - 14 September, 2018
Art Exhibition
123 DATA - Paris, Fondation Groupe EDF, 6 rue Récamier, Paris - France, May 4 - October 6, 2018
AI Art Gallery
NIPS Machine Learning for Creativity and Design 2017., Long Beach - USA, December 4-9, 2017
Kantar Information is Beautiful Awards 2017
The Winners: Unusual 2017, Forma Fluens
Lecture - Data visualization and artificial intelligence: exploration of unstructured data and models
University College London - UCL, November 28, 2017
Sustainable Development Cinema
World Resources Forum 2017, Geneva - Switzerland, October 24-25, 2017
Open lecture - Forma Fluens
Brera Design Days 2017, Milan, October 7, 2017
IEEE InfoVis 2017 Art Exhibition
Sustain & Decay: VISAP’17 Exhibition, Phoenix - Arizona, October 1-6, 2017
Keynote - Beautiful Science | Estetica e Conoscenza
Forum della Leopolda 2017, Florence, September 29, 2017
Keynote - Beauty and The Data
DATA NATIVES 2017, City University of London, April 28, 2017
The 2017 Vizzies Visualization Challenge - National Science Foundation & Popular Science
Winner - Best Scientific Video, Network Earth
Innovation by Design Awards 2016 - FastCompany
Finalist for Websites & Platforms, Watson News Explorer
Kantar Information is Beautiful Awards 2016
Silver - Commercial Project, IBM Watson News Explorer
RIXC Art Science Festival 2016
Open Fields, Riga, Latvia, September 29 - November 2, 2016
Places and Spaces exhibition
Charting Culture, Places & Spaces: Mapping Science exhibit, 2016
TEDxRiga 2016: Dare to Be
About AI, BigData, Design, Riga, Latvia, June 17, 2016
Open lecture: DataViz & AI
Skoltech University, Moscow, Russia, April 29, 2016
Point, Line & Data: New methods for understanding complex data, from storytelling to machine learning
CNS Center, Indiana University, Bloomington, April 25, 2016
Kantar Information is Beautiful Awards 2015
Gold - Data Visualization, Rise of Partisanship
Kantar Information is Beautiful Awards 2015
Honourable mention - Motion Infographic, Charting Culture
The 2015 Vizzies Visualization Challenge - National Science Foundation & Popular Science
Finalist - Video, Charting Culture
Data Visualization and Artificial Intelligence: The Real Time Exploration of Unstructured Big Data
SYSTEMS ANALYSIS 2015, Vienna, Austria, 11-13 Nov, 2015
RIXC Art Science Festival 2015
DATA DRIFT, Riga, Latvia, October 10 – November 22, 2015
Global Exchange
Lincoln Center, New York City, USA, September, 2015
Networks, Visualization and Society
École Polytechnique Fédérale de Lausanne, Lausanne, Switzerland, May 18, 2015
Big Data Fest
New York Hall of Science, New York City, USA, March 28, 2015
Skoltech lectures on Visualization
Skoltech University, Moscow, Russia, February 20, 2014
Big Data Workshop
University of Massachusetts, Boston, October 2013
Visualizing Models
IBM Research Colloquium, São Paulo, Brazil, August 2013
World Economic Forum Workshop on the Design of Complexity
MIT, Cambridge, July 2013
Urban Interaction Design - SEMINAR SPRING 2013
Department of Computer Science University of Houston, February 2013
Ars Electronica Festivals 2011
Festival for Art, Technology and Society, Linz, 31.8.-6.9.2011
Sensing Place / Placing Sense
MIT Media Lab, Cambridge, USA
TEDx Cambridge THRIVE
Harvard University, Cambridge, USA
Tec Art Eco - Arts, Environment and Technology
Lugano, Switzerland, May 5-8, 2011
Maps for The 21st Century
Royal Geographical Society, London, United Kingdom
Maps for The 21st Century
The Serpentine Gallery, London, United Kingdom
MAPS DLD10 - Connect the unexpected
DLD10, Munich, Germany
SENSEable Cities: Exploring Urban Futures
GAFTA, San Francisco, USA
Desertmed
Villa Romana, Firenze, Italy
Real Time Copenhagen
Copenhagen’s Kulturnatten, Copenhagen, Denmark