Mapping the NFT revolution: market trends, trade networks, and visual features
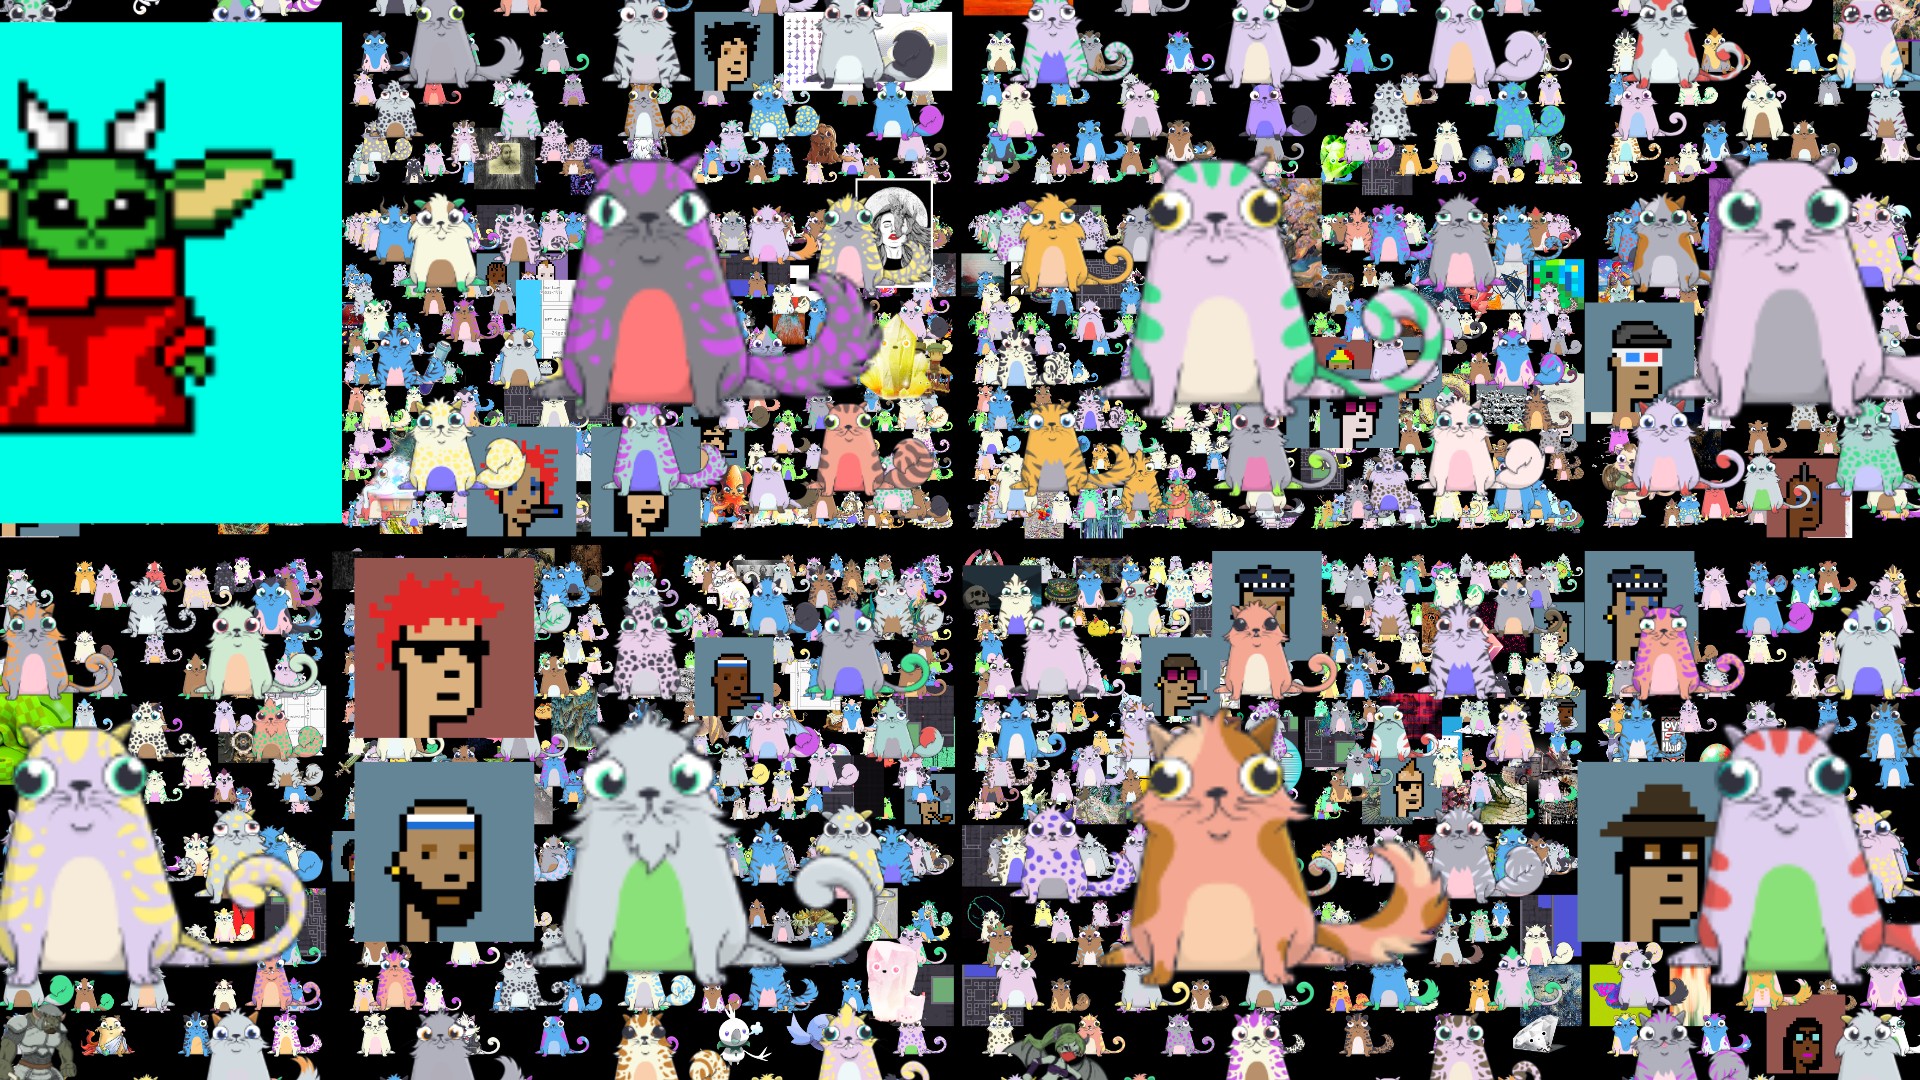
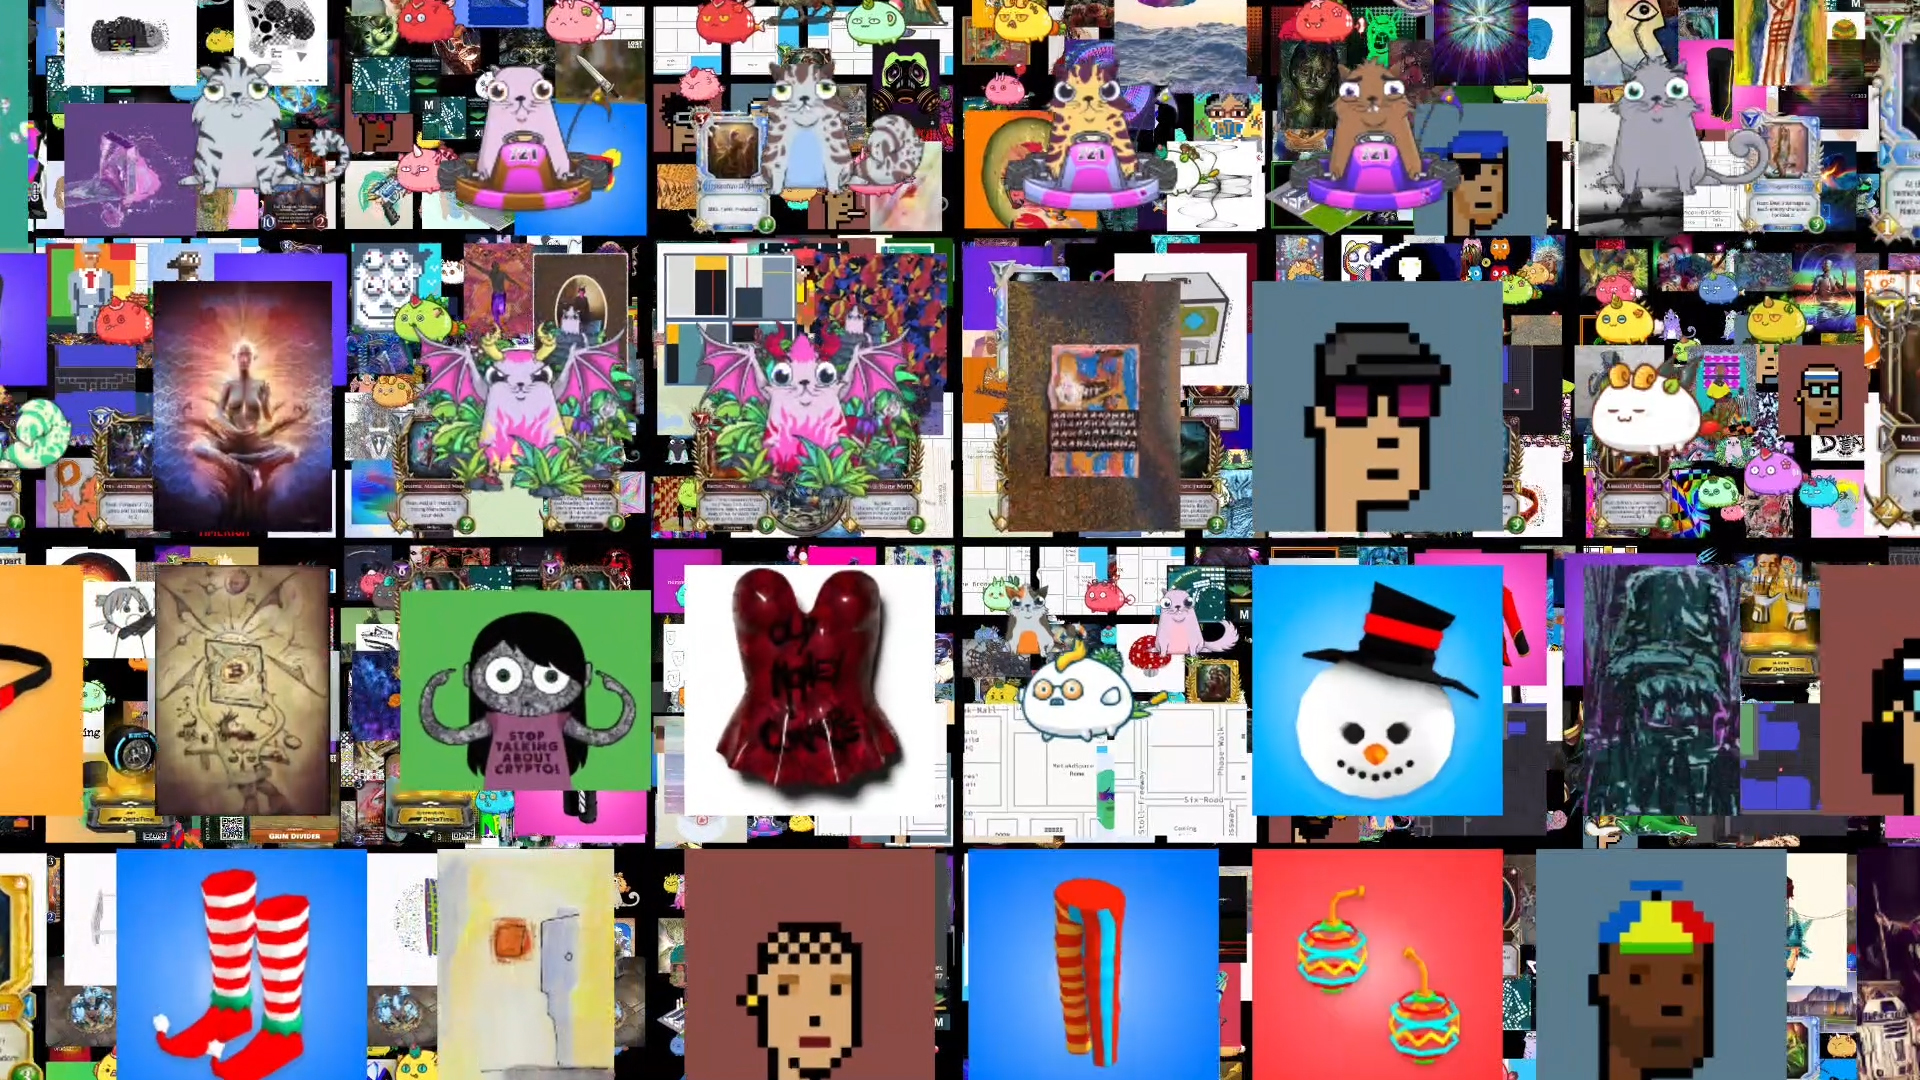
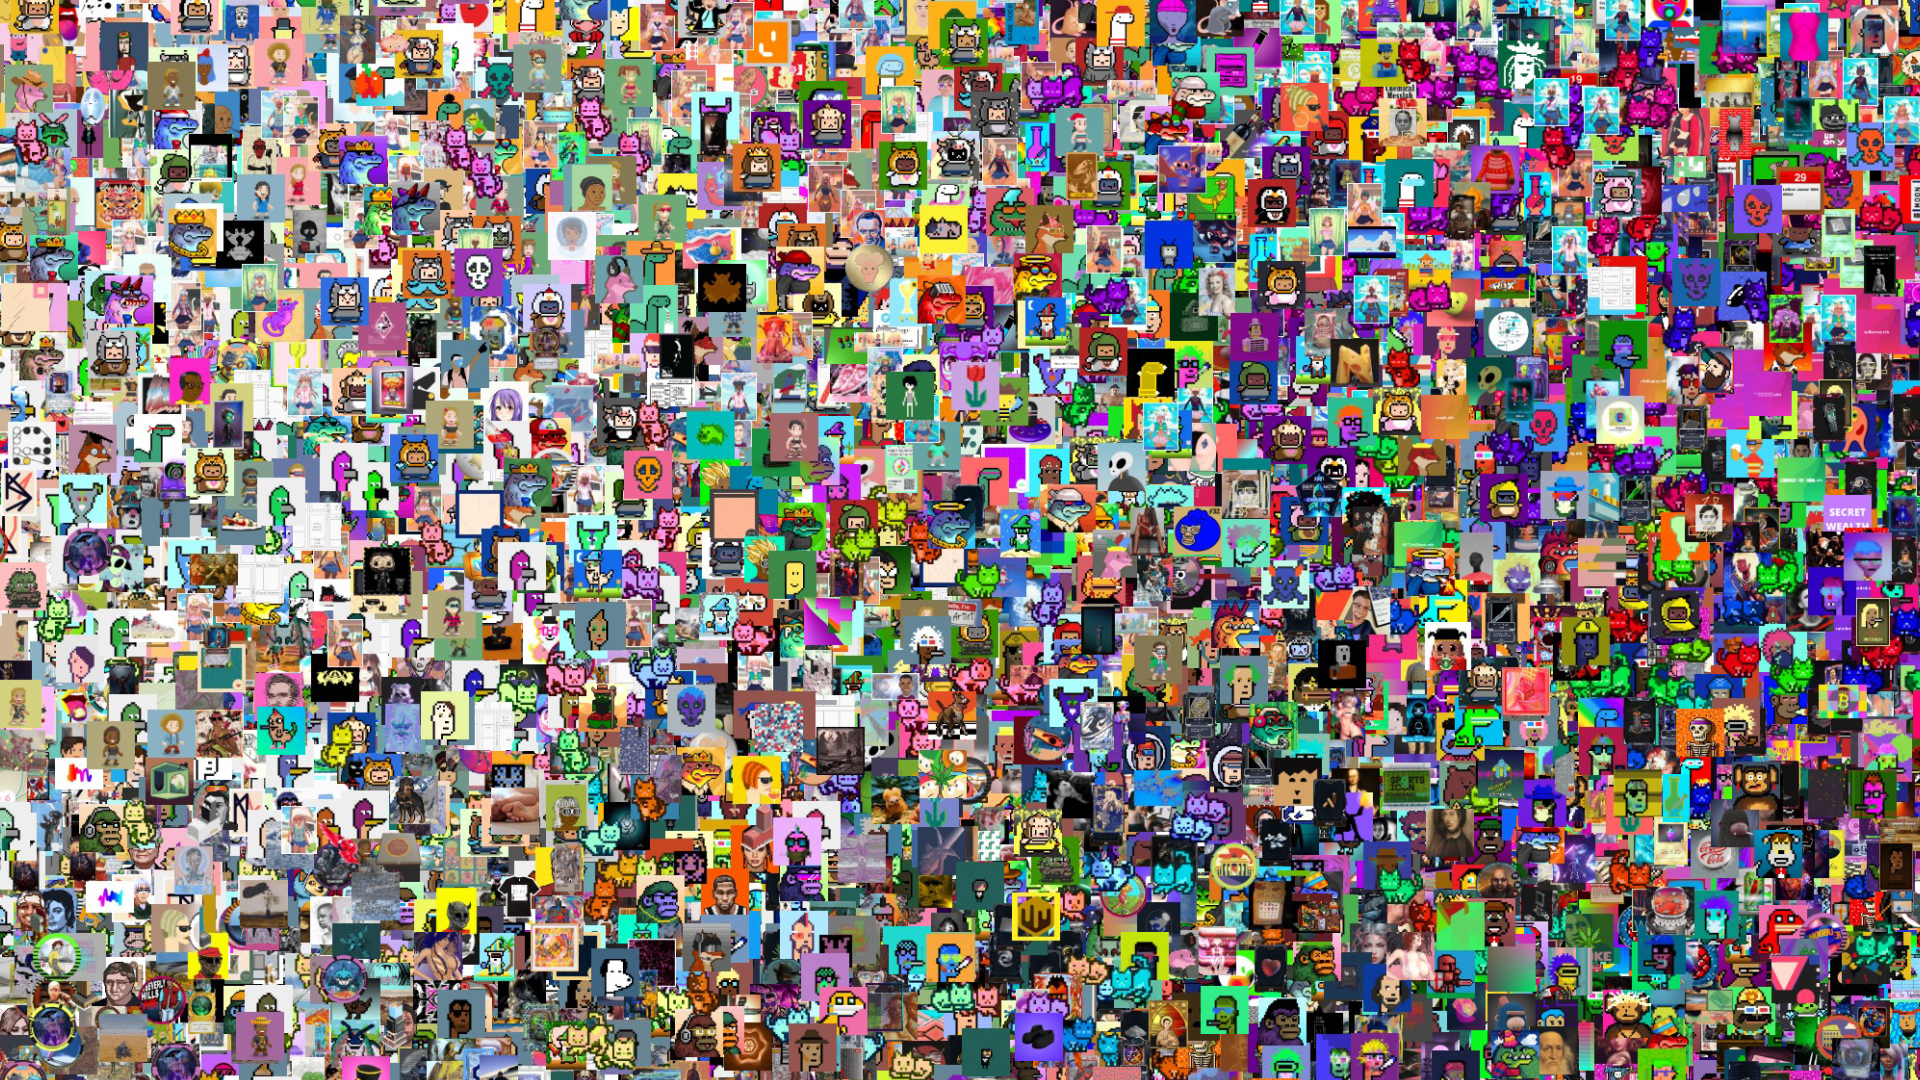
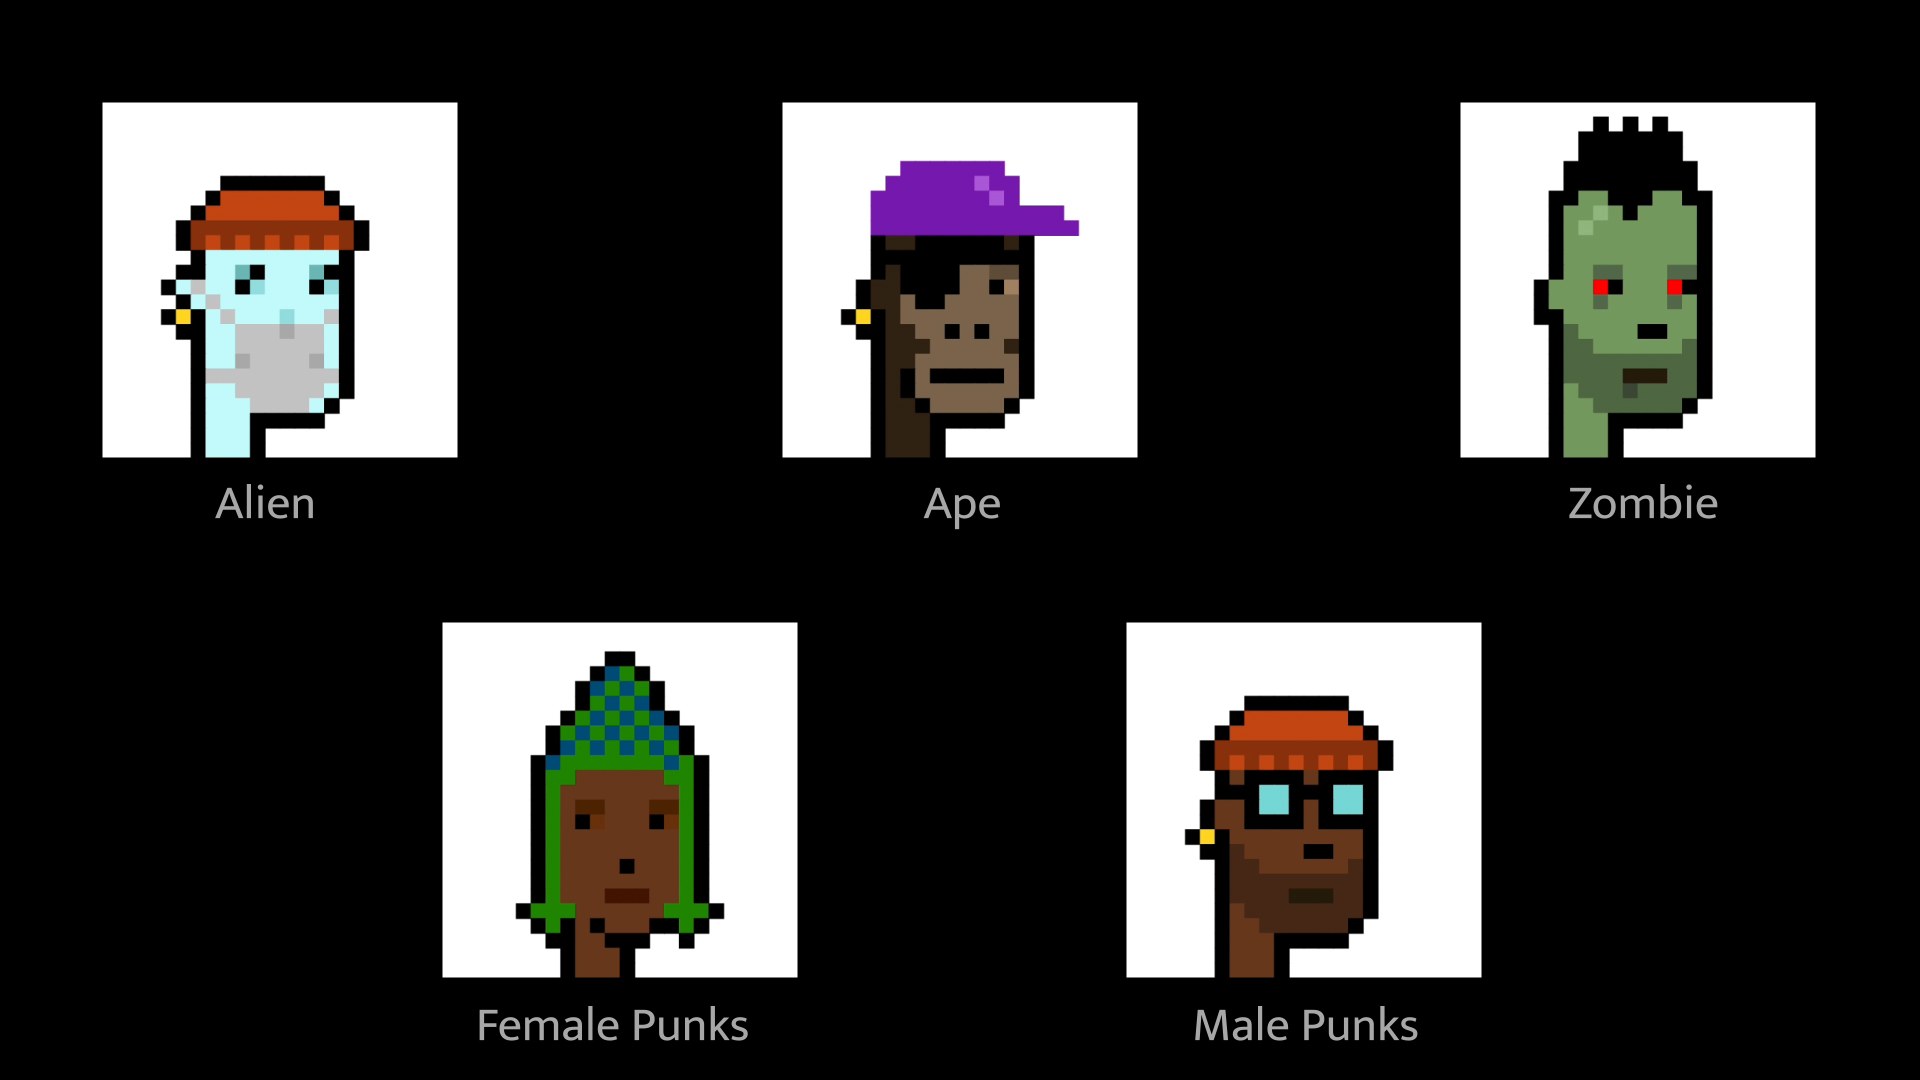
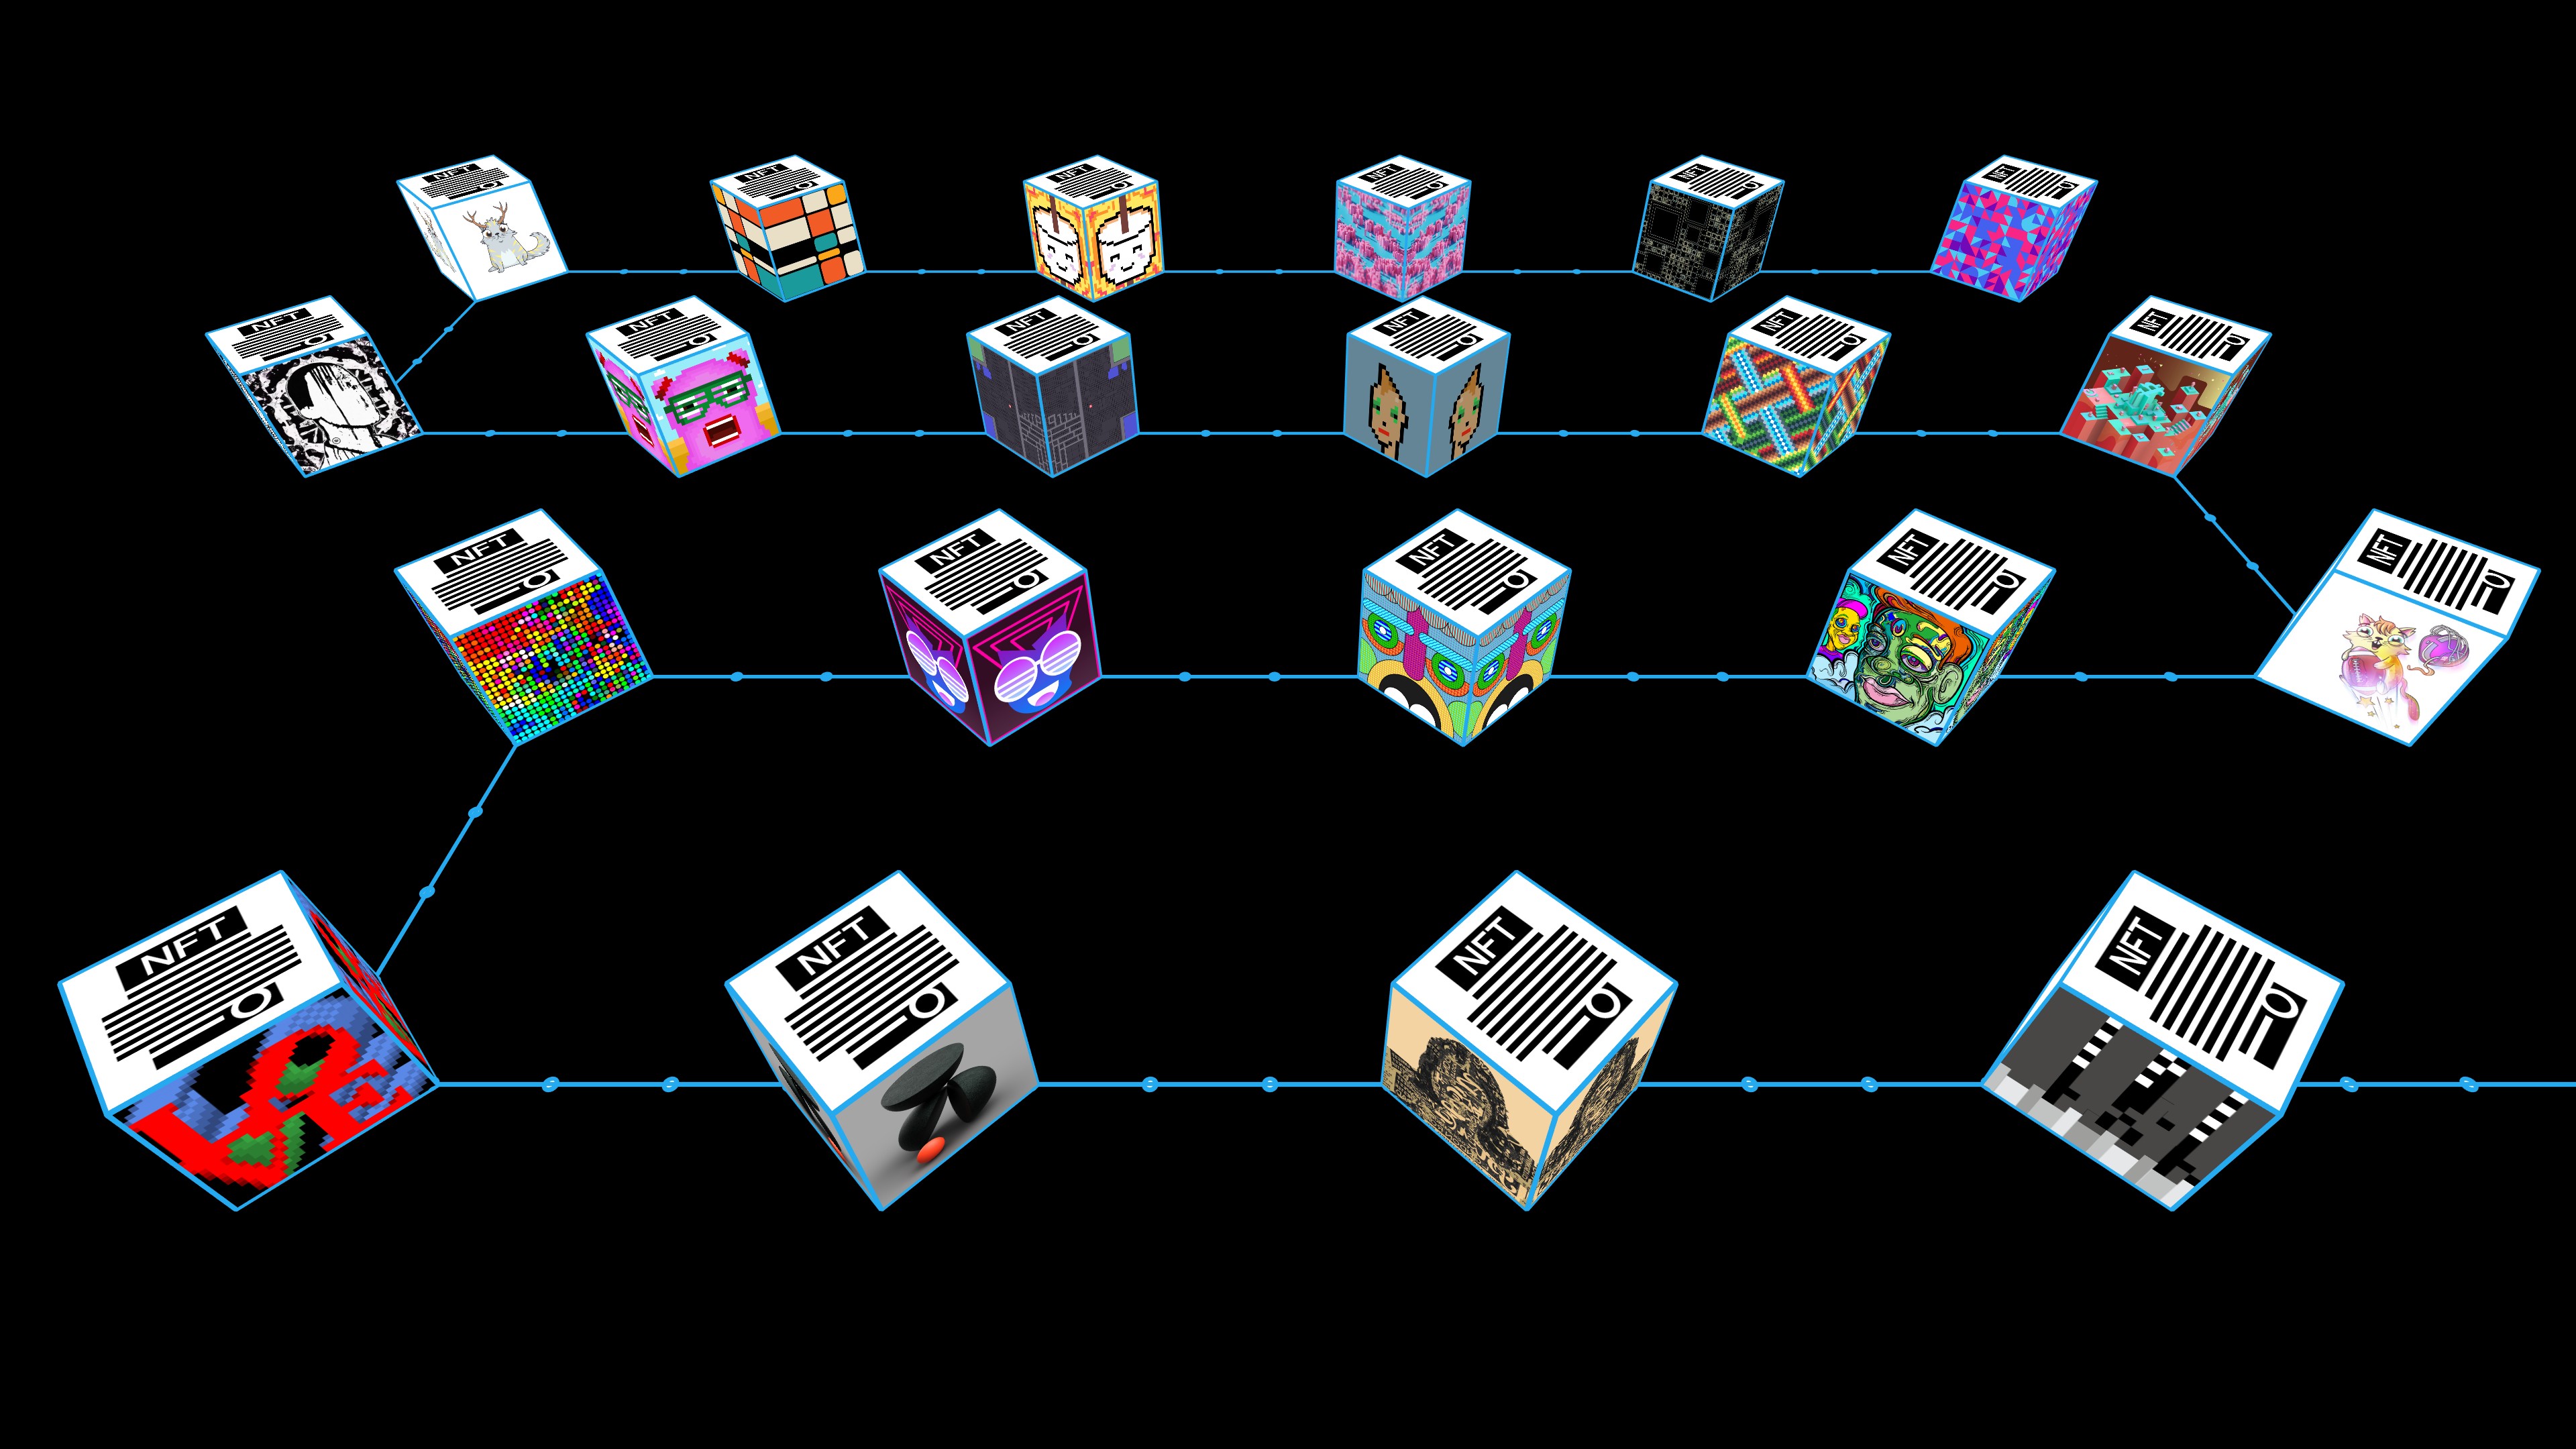
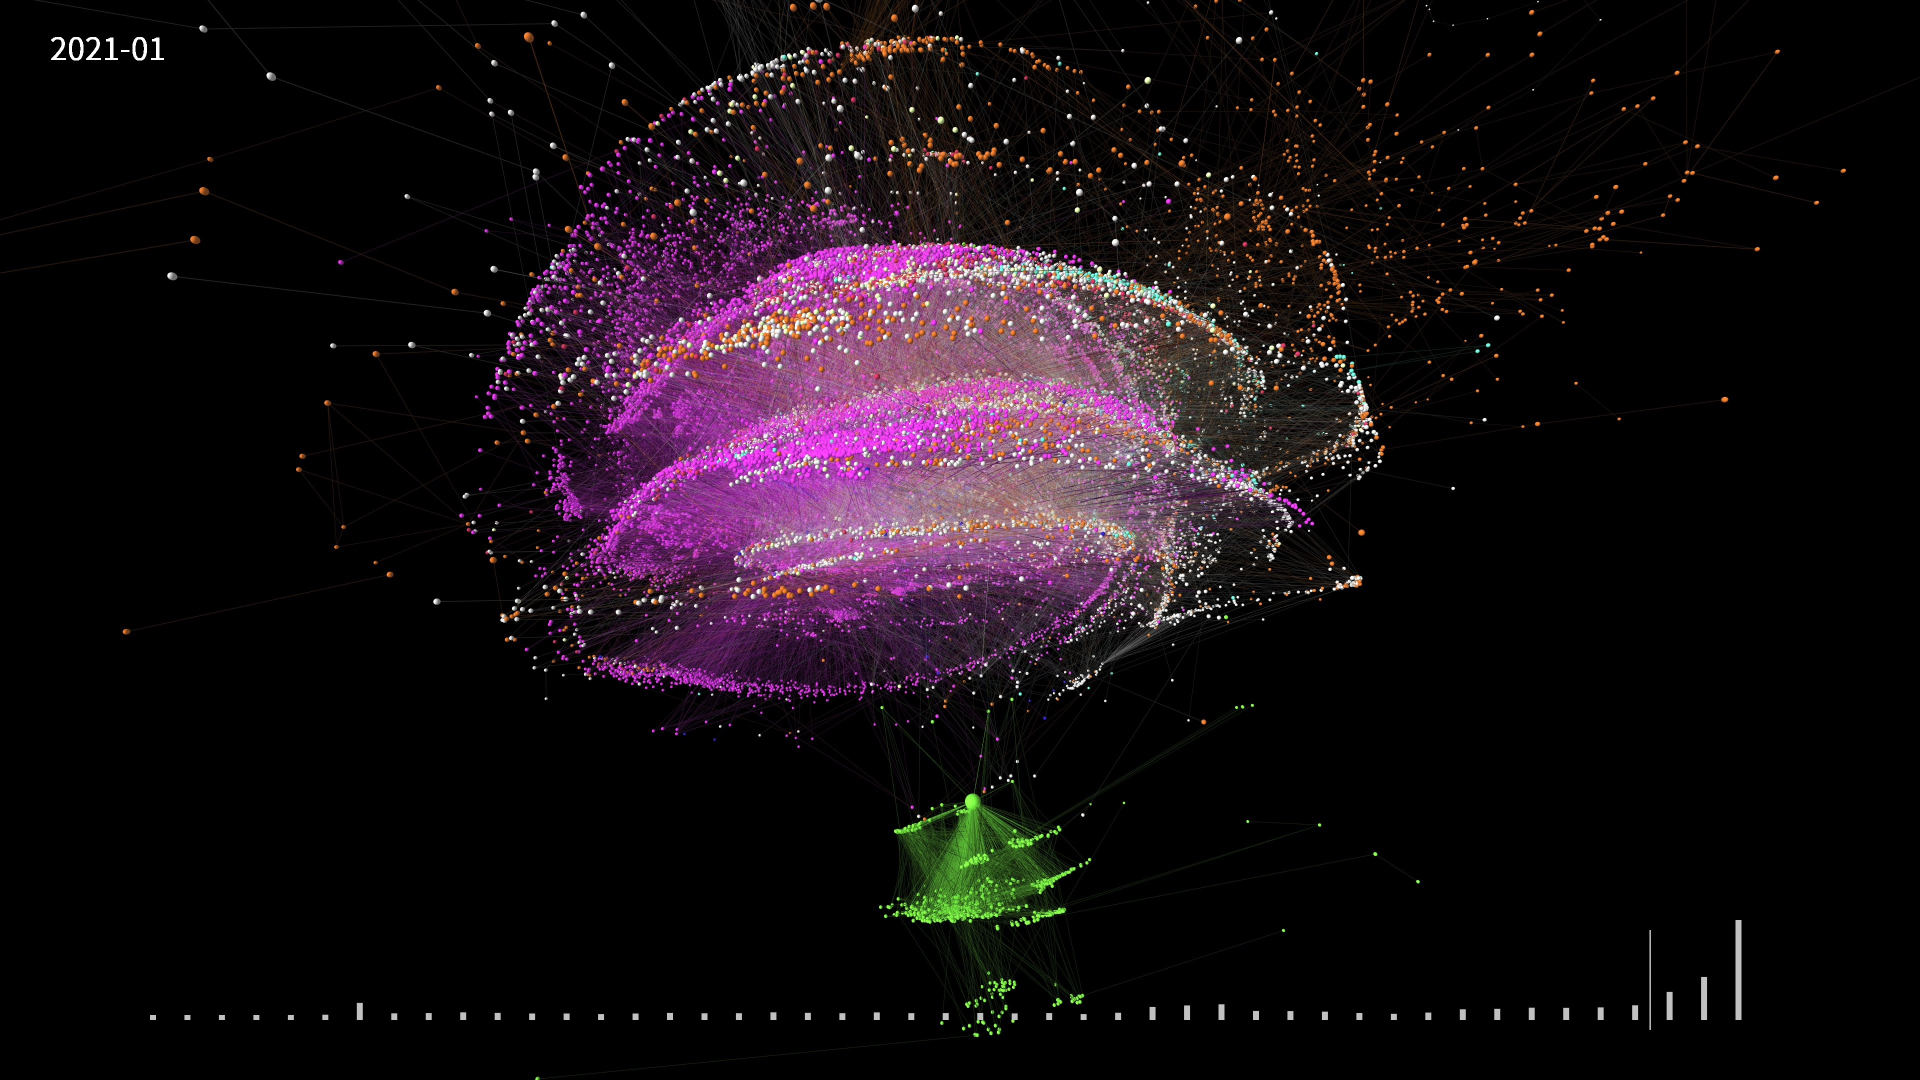
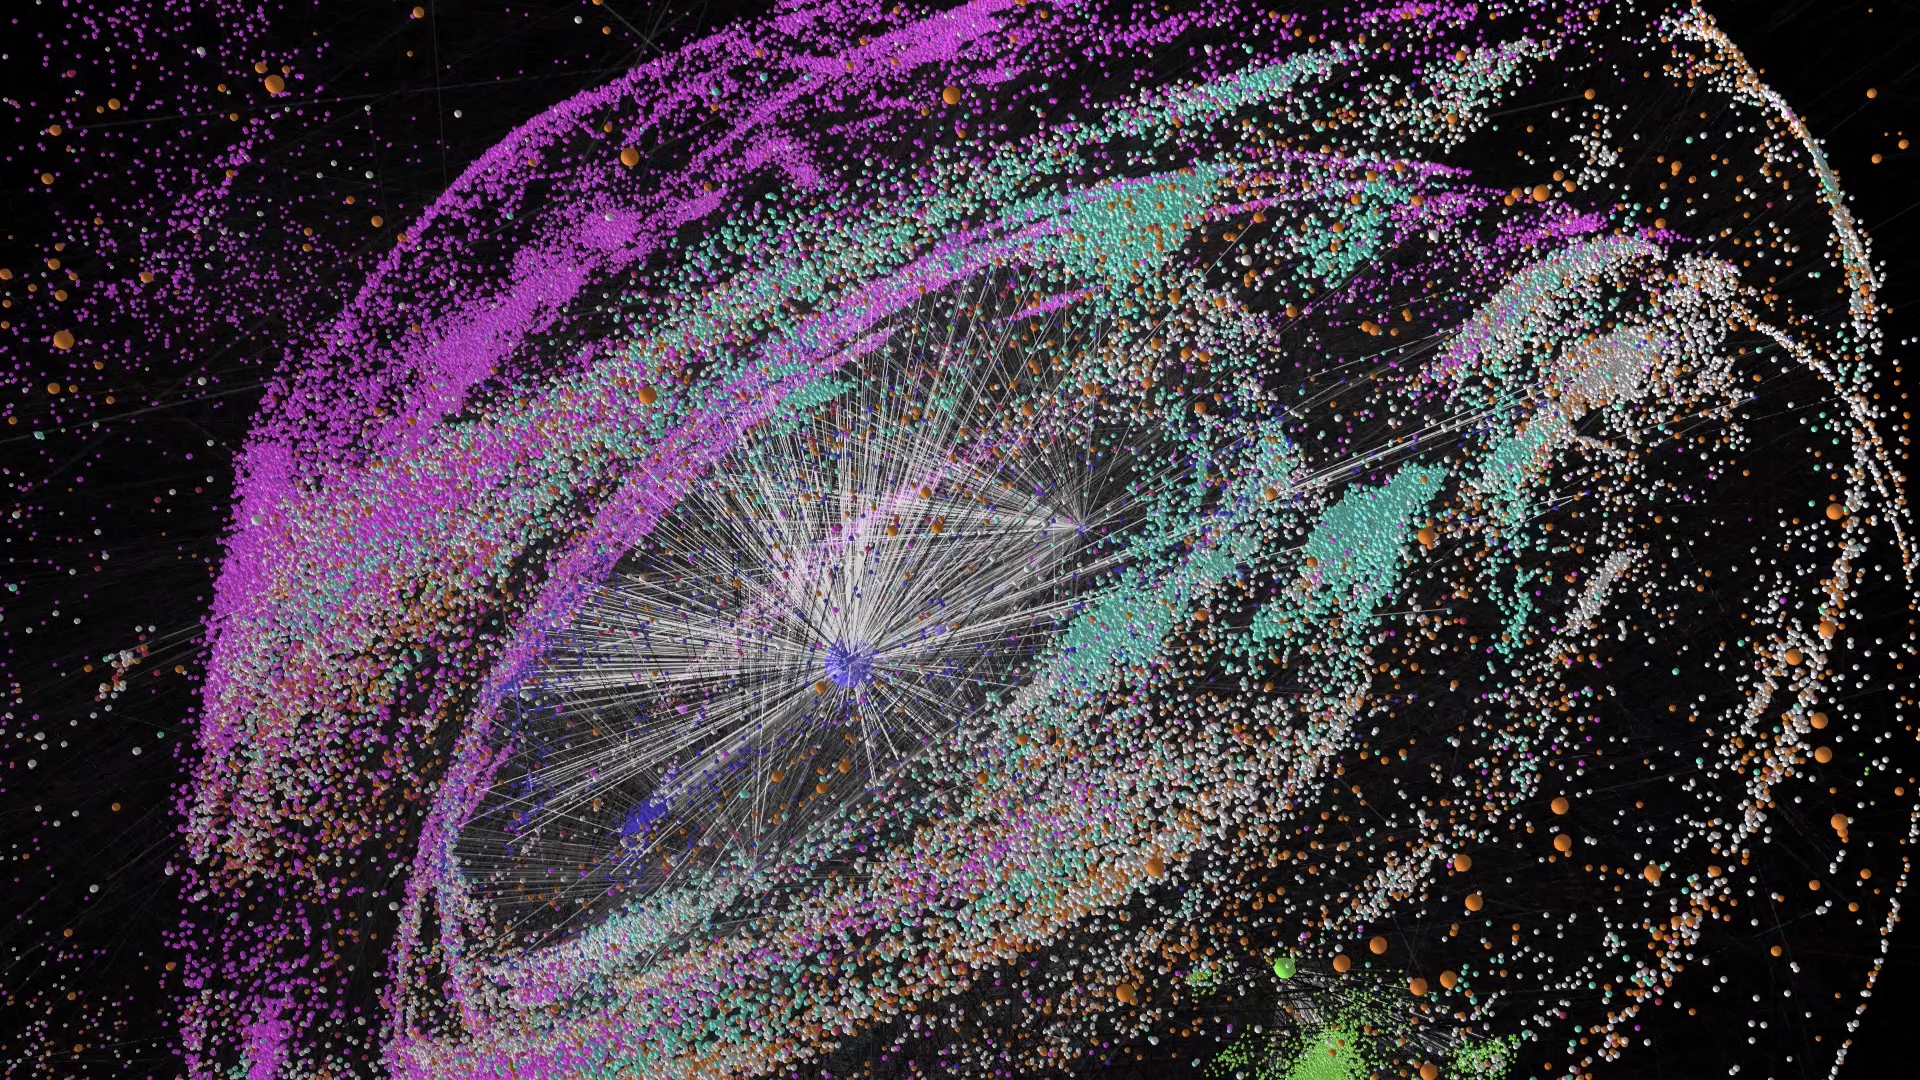
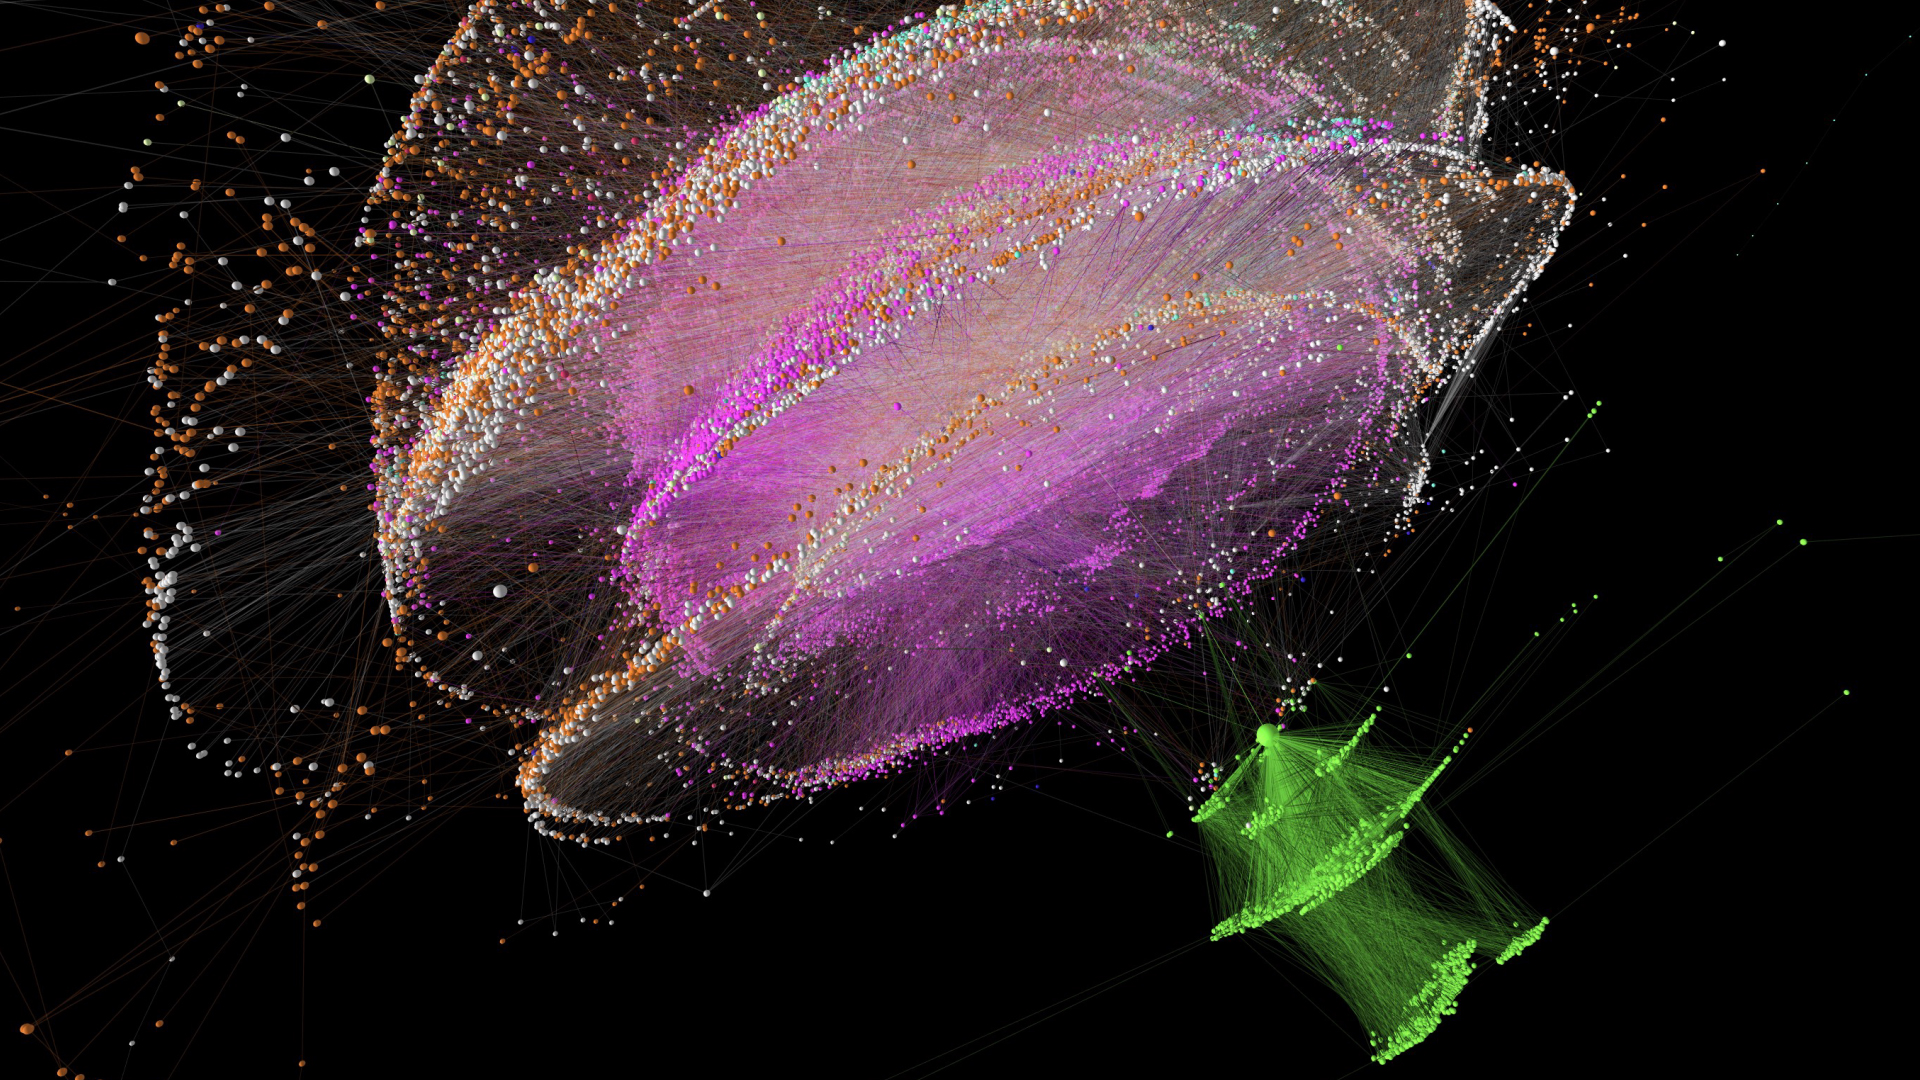
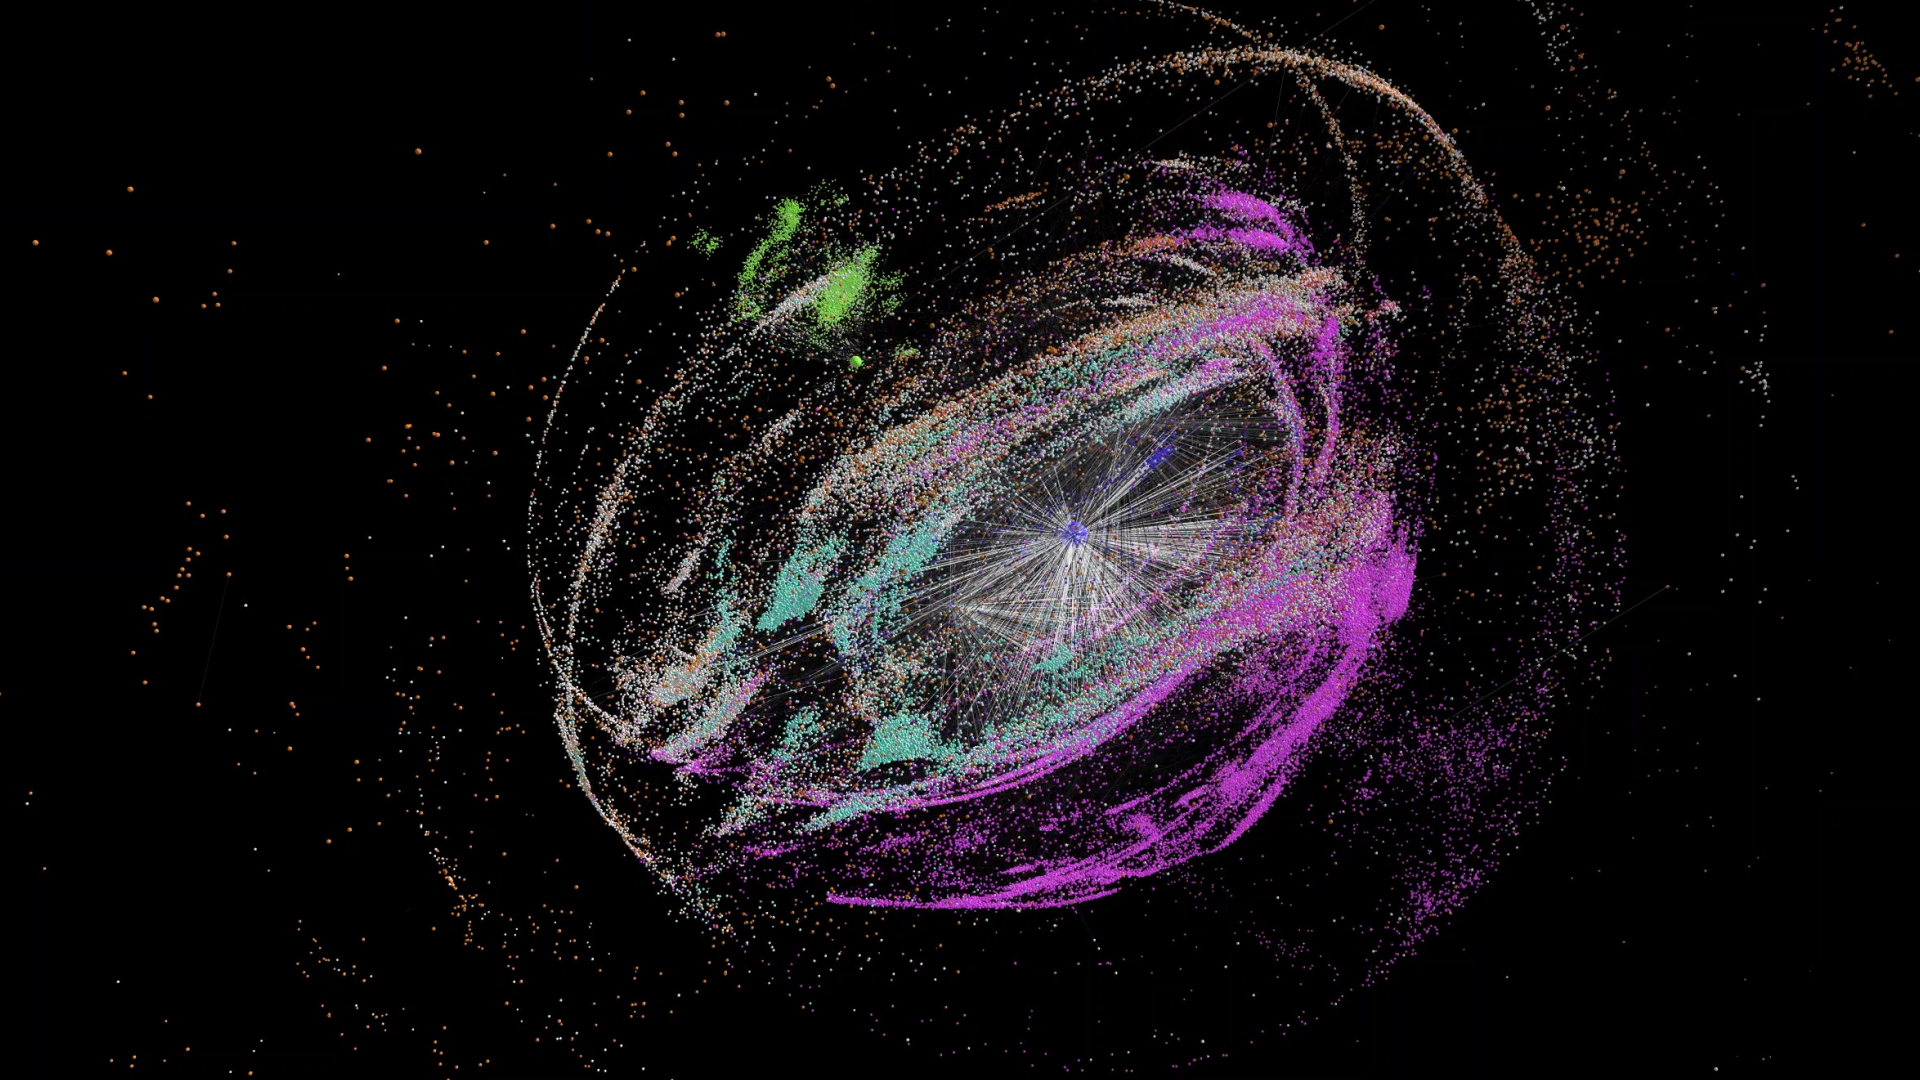
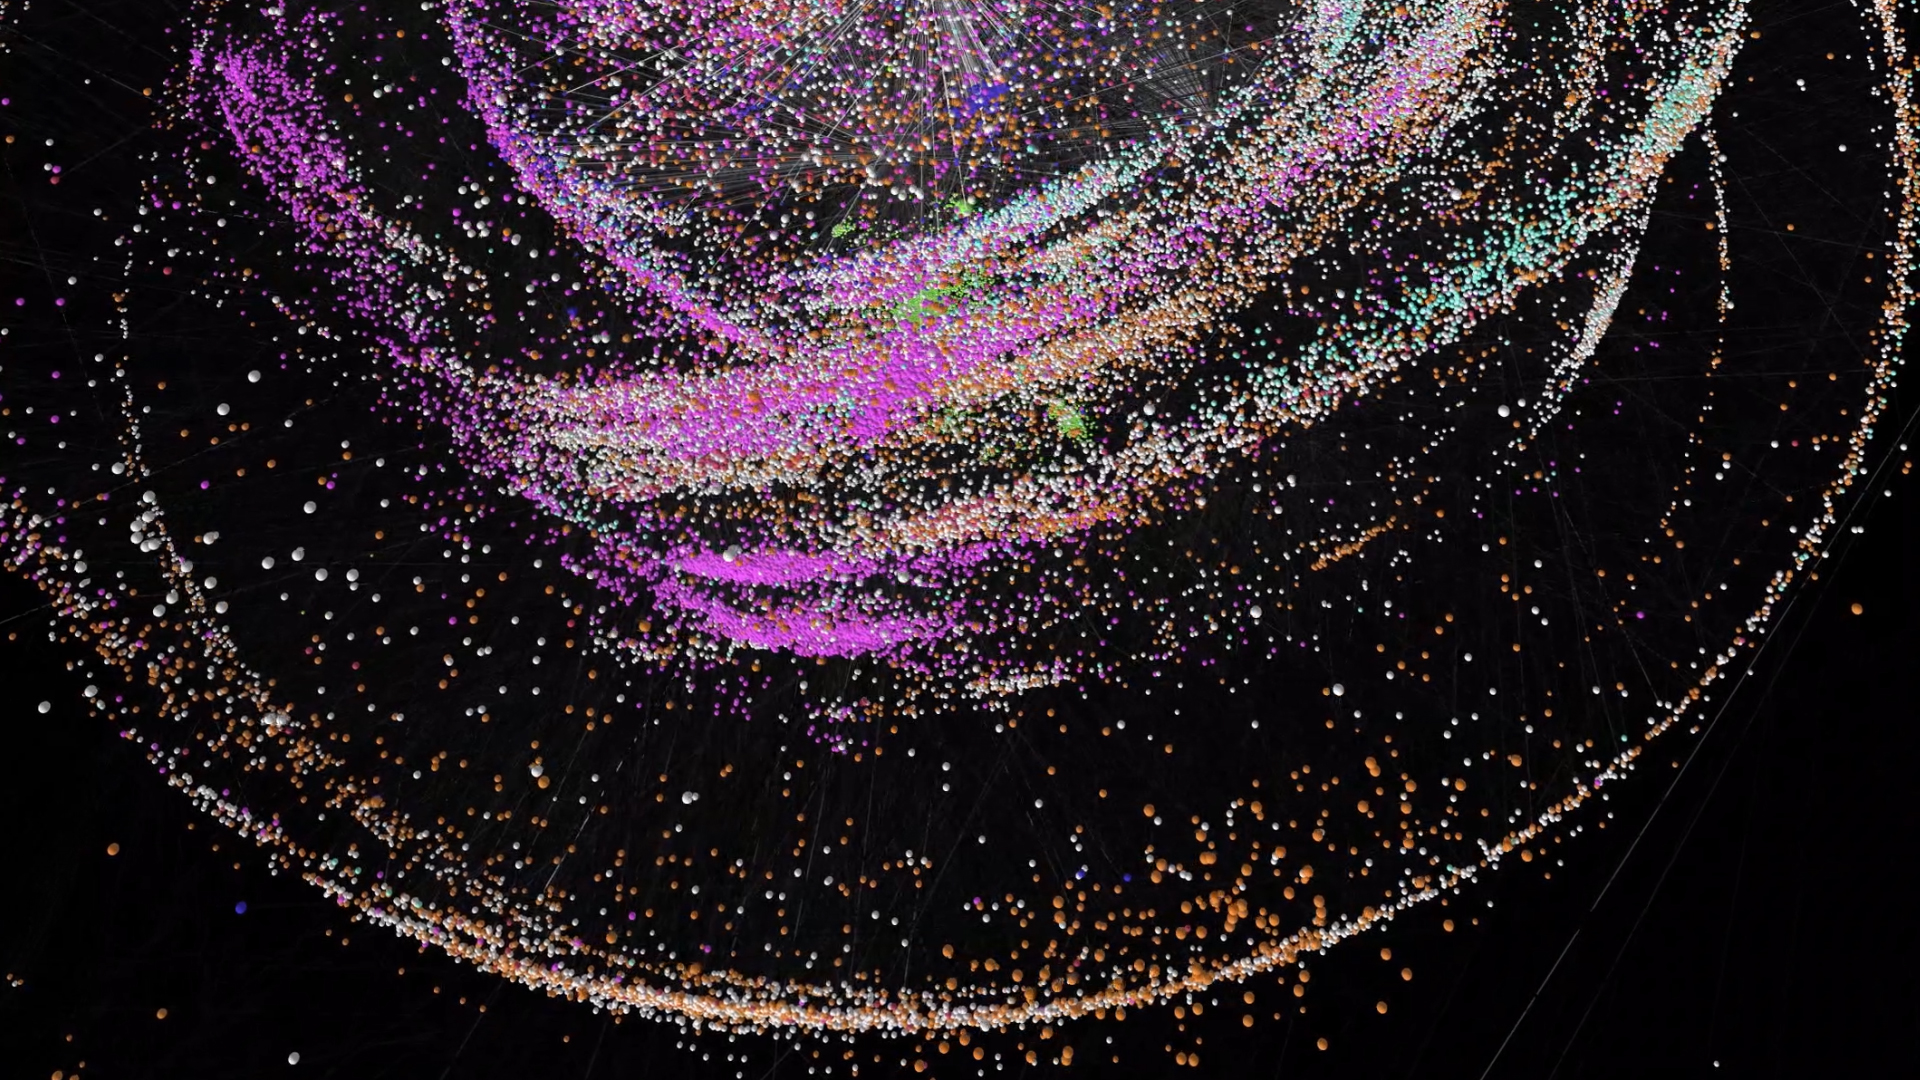
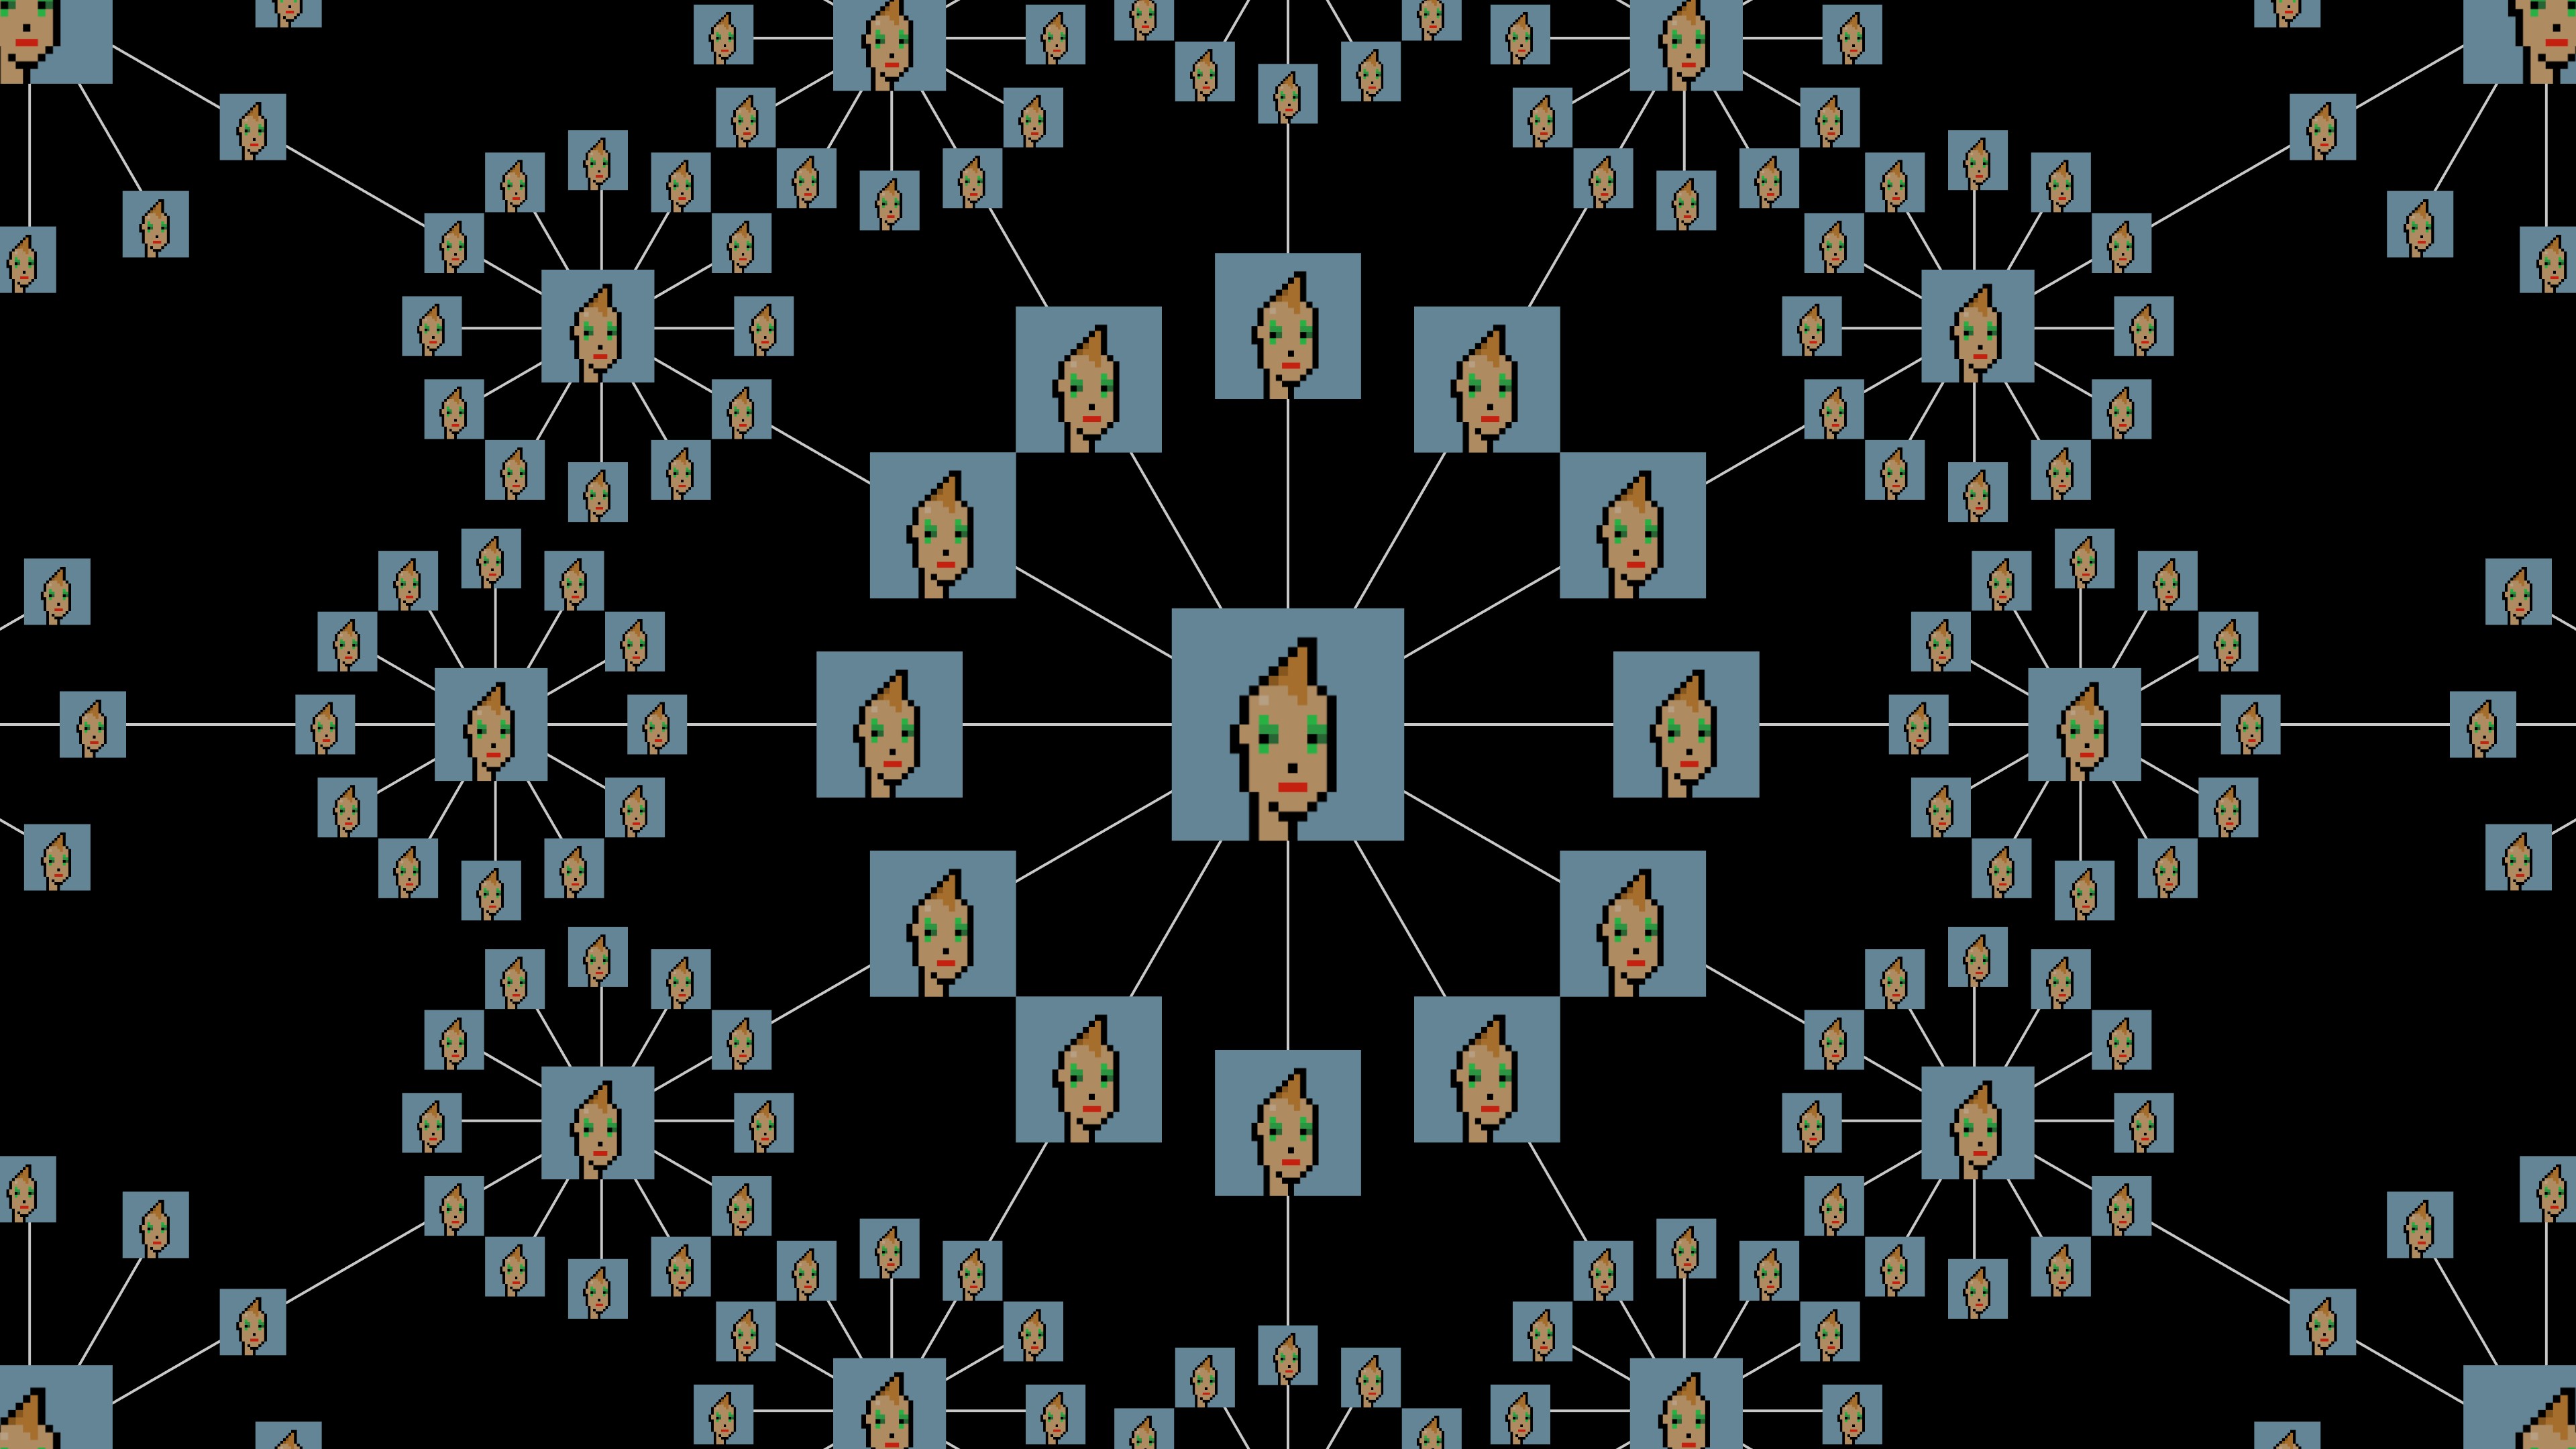
Non Fungible Tokens (NFTs) are digital assets that represent objects like art, collectible, and in-game items. They are traded online, often with cryptocurrency, and are generally encoded within smart contracts on a blockchain. Public attention towards NFTs has exploded in 2021, when their market has experienced record sales, but little is known about the overall structure and evolution of its market. Here, we analyse data concerning 6.1 million trades of 4.7 million NFTs between June 23, 2017 and April 27, 2021, obtained primarily from Ethereum and WAX blockchains. First, we characterize statistical properties of the market. Second, we build the network of interactions, show that traders typically specialize on NFTs associated with similar objects and form tight clusters with other traders that exchange the same kind of objects. Third, we cluster objects associated to NFTs according to their visual features and show that collections contain visually homogeneous objects. Finally, we investigate the predictability of NFT sales using simple machine learning algorithms and find that sale history and, secondarily, visual features are good predictors for price.